Blog
-
New Charts Available in FlowFuse Dashboard
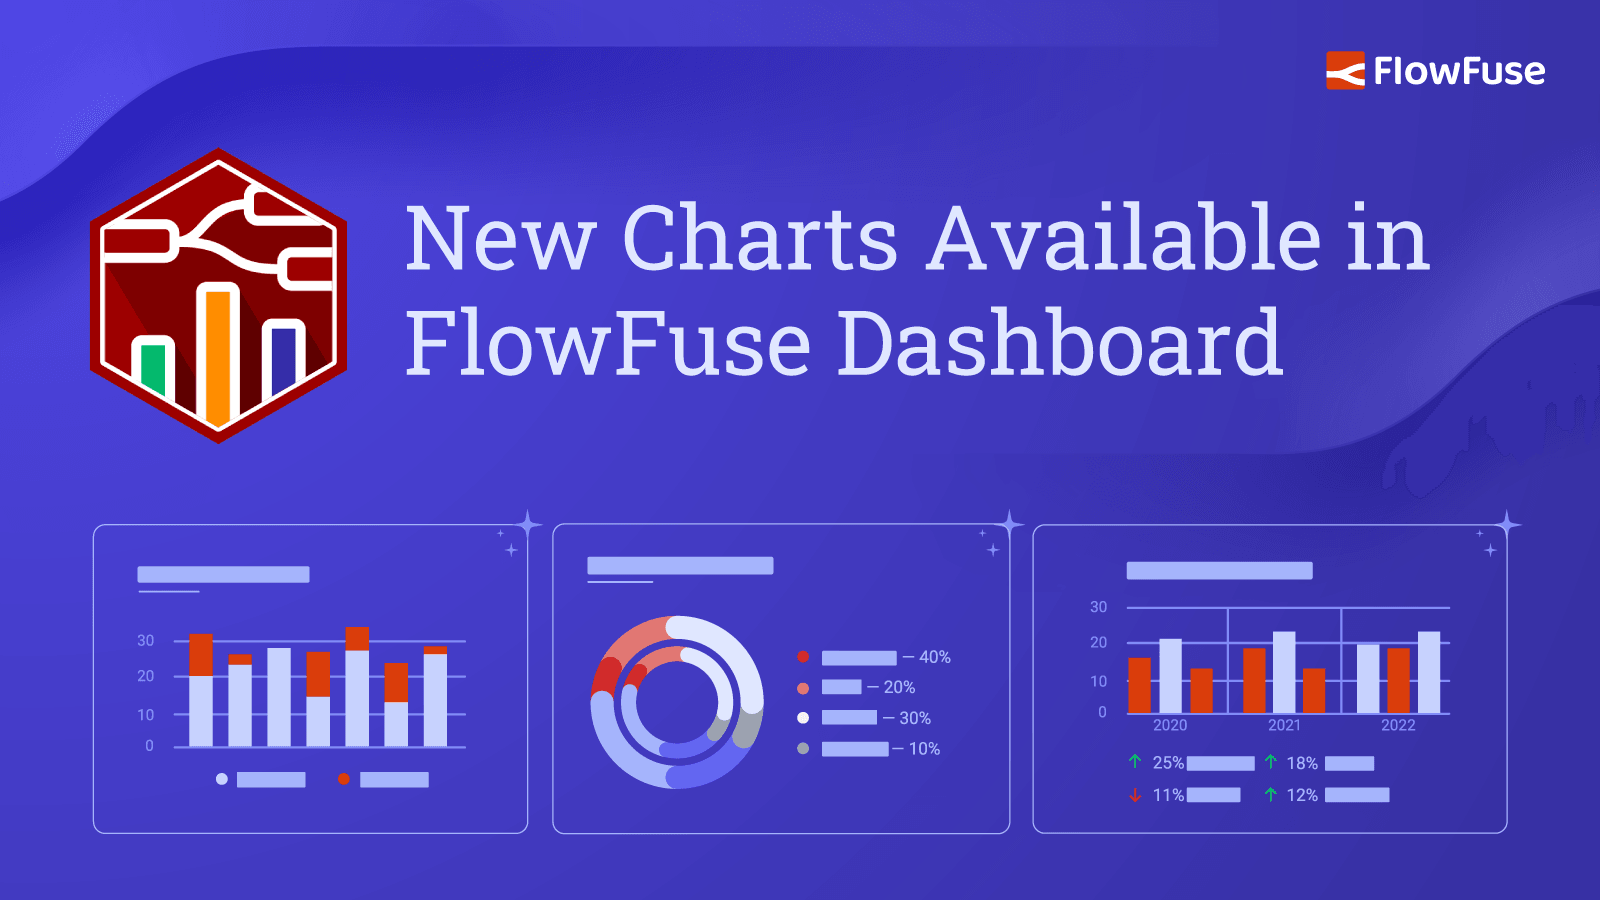
It's been a while coming, but we've finally introduced a new set of chart types to FlowFuse Dashboard. We've added Pie, Donut and Grouped (Stacks and Side-by-Side) Bar charts to the UI Chart node. We've also shipped plenty of other improvements and fixes in this release, so let's dive in.
read more... -
Evolution of Technology: Impact on Job Roles and Companies
Throughout history, technology has continuously transformed industries, job roles, and entire companies. While these changes often evoke fear and resistance, they also create new jobs, opportunities for innovation and growth. This post will explore how historical technological advancements have reshaped both individual job roles and entire companies, examine current trends like AI and low-code tools, and discuss the critical importance of adaptability for both individuals and businesses in navigating technological disruption, Importantly, we will address the pressing question of our time: "How can AI and low-code tools both enhance and challenge human capabilities, creativity, and the job market, and is this the next frontier in manufacturing or just hype"
-
How to Set Up SSO SAML for Node-RED
SSO plays a crucial role in modern enterprise environments by simplifying user authentication across multiple applications. At FlowFuse, we recognize the significance of SSO and offer robust support for integrating it with your self-hosted platform. In this comprehensive guide, we will focus on configuring SSO SAML, specifically using Google as the Identity Provider (IdP). We also support SSO with LDAP. For more information, refer to Setting up LDAP SSO for your Self-Hosted FlowFuse.
-
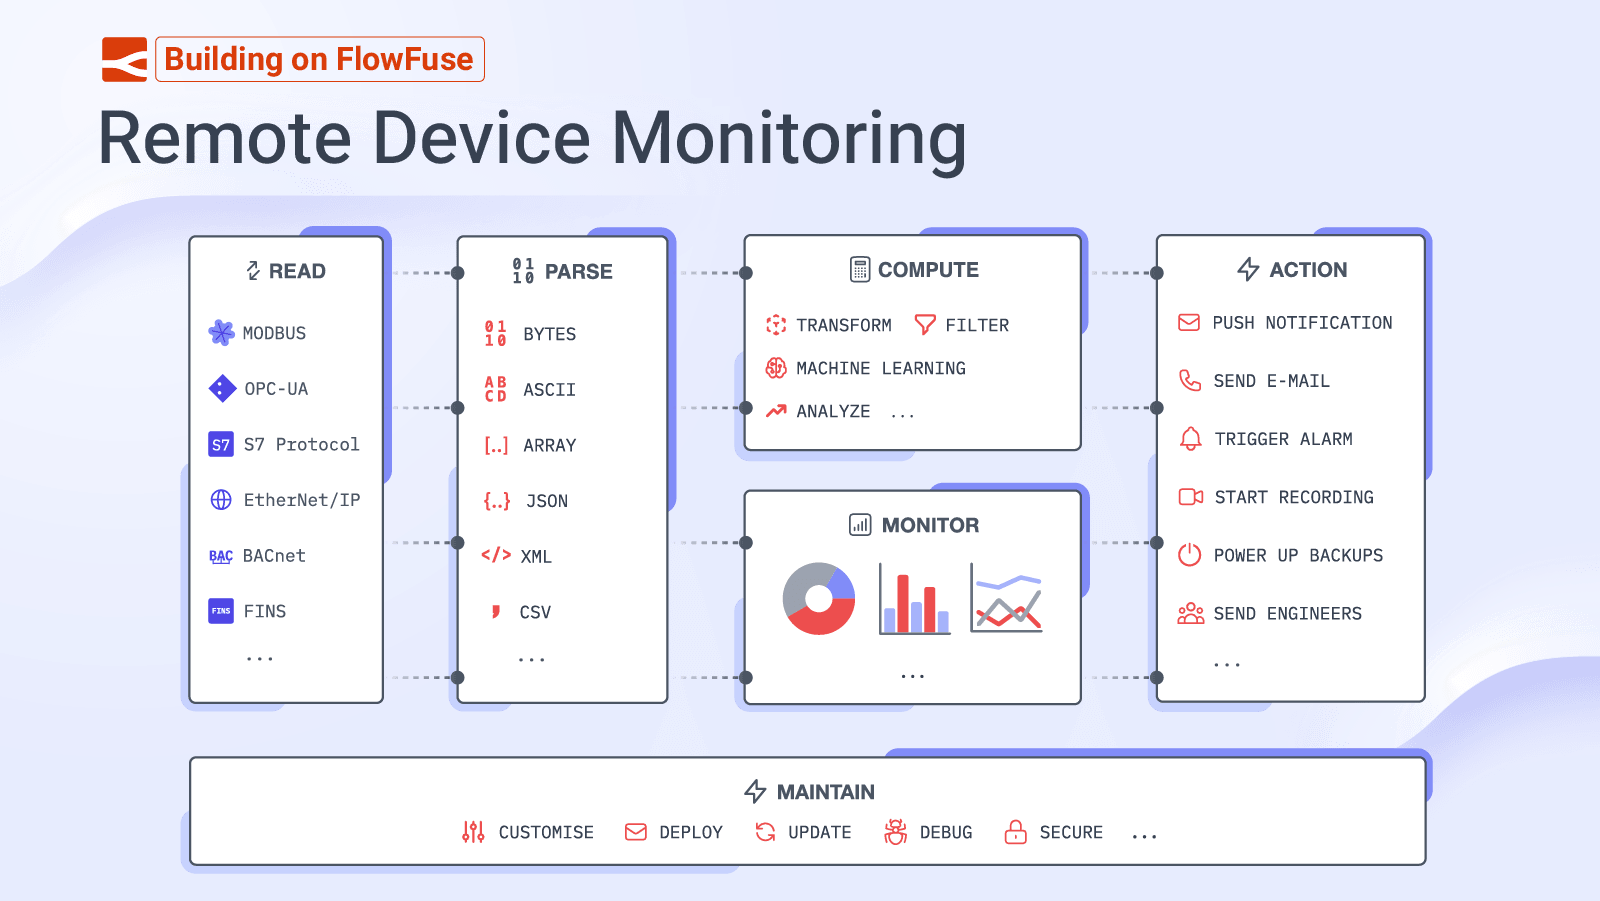
Building on FlowFuse: Remote Device Monitoring
{% from "stories/customer-story.njk" import storyTile %}
FlowFuse has established a rich ecosystem of products to help you build bespoke, powerful, low-code applications.
We've seen customers utilizing these to revolutionise precision manufacturing, automate building management and modernize the distribution of global weather data, just to name a few examples.
In this series of articles, we'll be taking a look at the common architectures and design patterns we are seeing used across our customer base, and how you can use these to build your own applications. To kick things off, this article will focus on "Remote Device Monitoring".
-
Deploying FlowFuse with Docker on an Ubuntu server
With Node-RED's increasing role in IoT, FlowFuse Cloud has become a favored platform for deploying production Node-RED applications. It offers extensive features at a low cost, reducing operational overhead. However, the cloud is not the only option we provide; we also offer a self-hosted option for users who prefer to deploy FlowFuse on their servers. This guide demonstrates how to deploy FlowFuse on your Ubuntu server using Docker, covering key aspects such as domain setup, email, SSL, and more for real-world production scenarios
-
Calling a Python script from Node-RED
Python's robust data processing capabilities and extensive libraries are well-known in programming. When combined with Node-RED, these technologies can synergize to elevate data analytics and automation. This guide walks you through integrating Python scripts with Node-RED. You'll gain practical insights, troubleshooting tips, and effective techniques for executing scripts, enabling you to leverage this powerful combination for your IoT projects.
-
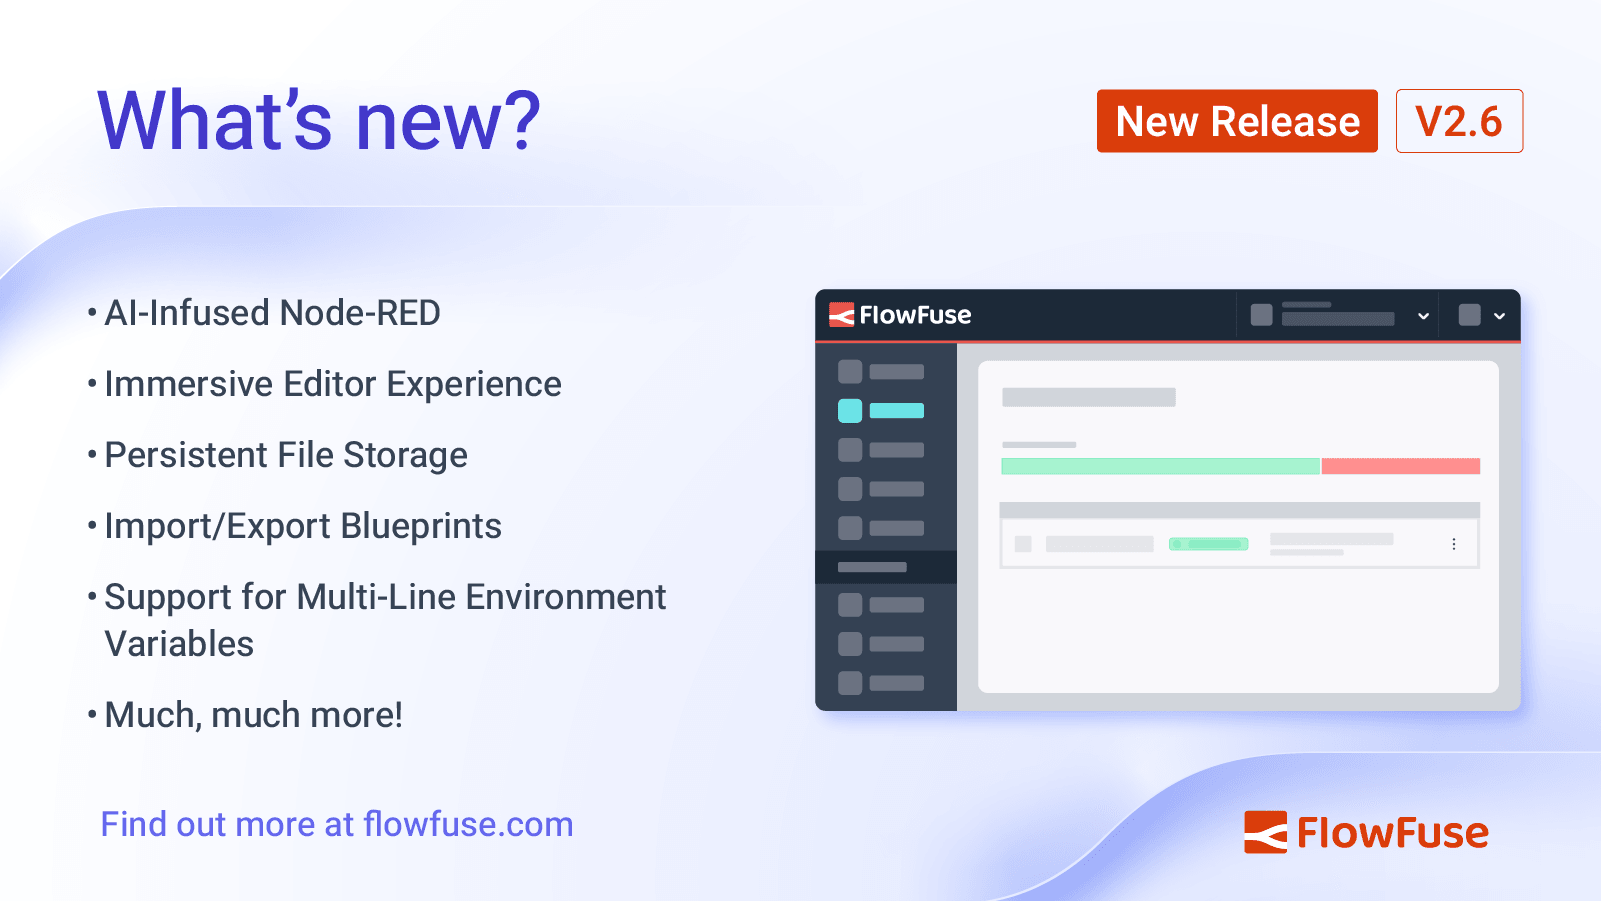
FlowFuse 2.6: AI Infused Node-RED, Persistent File Storage & Lots More
FlowFuse 2.6 is packed with great new features, and in this release we've had a heavy focus on improving the development experience of Node-RED, lowering the barrier to entry for new users and aligning to our Simplified Hosting and Low-Code plans from our Product Strategy.
-
Node-RED Dashboard Formally Deprecated
Dave Conway-Jones, the lead maintainer of Node-RED Dashboard, has just announced that Node-RED Dashboard has been formally deprecated, meaning there will be no further development activity on the project.
FlowFuse Dashboard (also known as Node-RED Dashboard 2.0) is a natural successor to Node-RED Dashboard, and in this article, we detail what FlowFuse Dashboard offers, and how you can get started.
-
Interacting with Google Sheets from Node-RED
Have you ever needed to integrate Google Sheets with your Node-RED application to track and manage data seamlessly? This guide will walk you through the process of integrating Google Sheets with Node-RED, enabling you to write, read, update, and delete data effortlessly.
-
Multi-Tenancy available for everyone with FlowFuse's Dashboard 2.0
FlowFuse Dashboard has featured multi-tenancy features through the FlowFuse User Addon. This made user based applications available only to specific FlowFuse team tiers and customers. However, the Node-RED community wanted to use the same feature set in cases FlowFuse didn't consider initially. Taking this feedback on board, today we announce some significant changes to how you can build Dashboards with multi-tenancy in mind.
Having taken that feedback on board, we've made some significant changes to how you can build Dashboards with multi-tenancy in mind.
-
Node-RED 4: Bringing better collaboration to FlowFuse Cloud
Node-RED 4.0 is the new major release of the project, which is at the heart of all we do at FlowFuse. It brings a range of new features that continue to make Node-RED the first choice for low-code development.
-
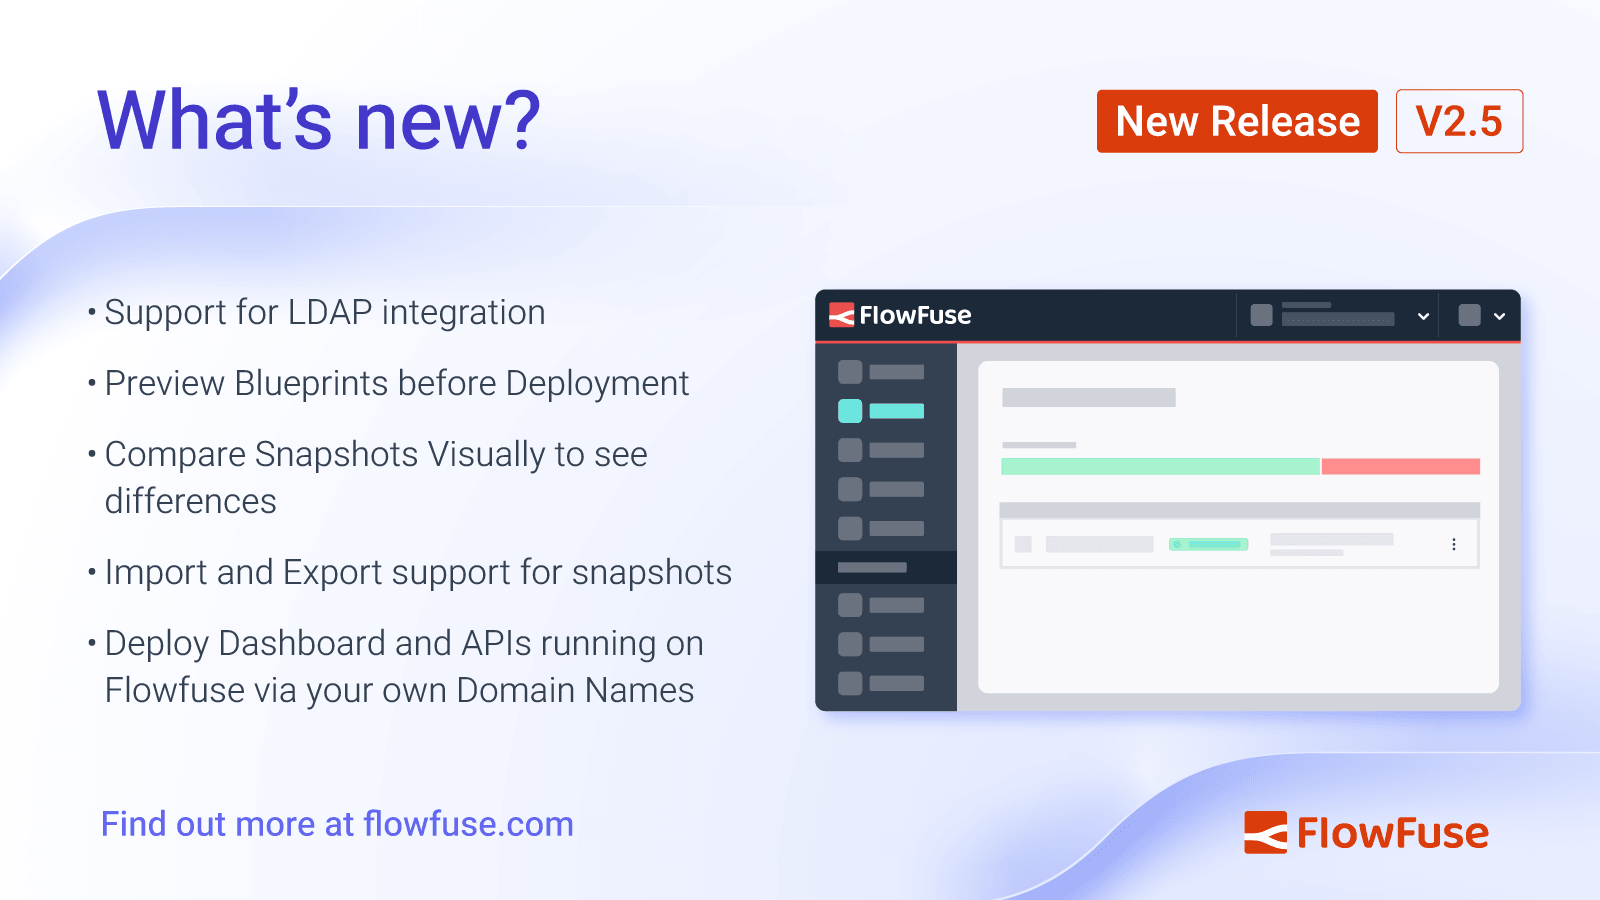
FlowFuse 2.5: New features to visualize snapshots, LDAP integration, and more
FlowFuse 2.5 introduces LDAP integration, snapshot comparison, extends the ability to preview flow to Blueprints, rounds out the management for snapshots, and allows you to point your own domain names at your FlowFuse instances.
-
Working with MQTT in Node-RED: Complete Guide (2026)
MQTT handles the messaging layer for most IoT deployments. Node-RED provides built-in nodes that connect to MQTT brokers, subscribe to topics, and publish messages—all through a visual interface.
-
Exploring Node-RED Dashboard 2.0 Widgets
This guide delves into Node-RED Dashboard 2.0 widgets. It is a guide on how to build a Dashboard application, and will cover many of the widgets available today.
-
Why you need a low-code platform
Digital transformation is a series of technological advancements that aim to simplify complex tasks. From calculators and graphical user interfaces (GUIs) to new programming languages, these advancements have enabled individuals to create value that was once beyond their reach. The key is to understand that these tools are not meant to replace expertise but to enhance it, making complex tasks more manageable, speeding up development time, and empowering more people.
-
Product Mission Statement and Strategy Updates
It's now been two years since our first ever
0.1.0release of FlowFuse. In that time, we've been working hard to build out a platform to help users elevate their Node-RED experience. In that time we've delivered some incredibly valuable features to FlowFuse users such as centralized instance management, remote deployments and version control. We've also learned a lot about our users, their needs, and how we can best serve them, and in a recent reflection on our product strategy decided to refine our product mission statement. -
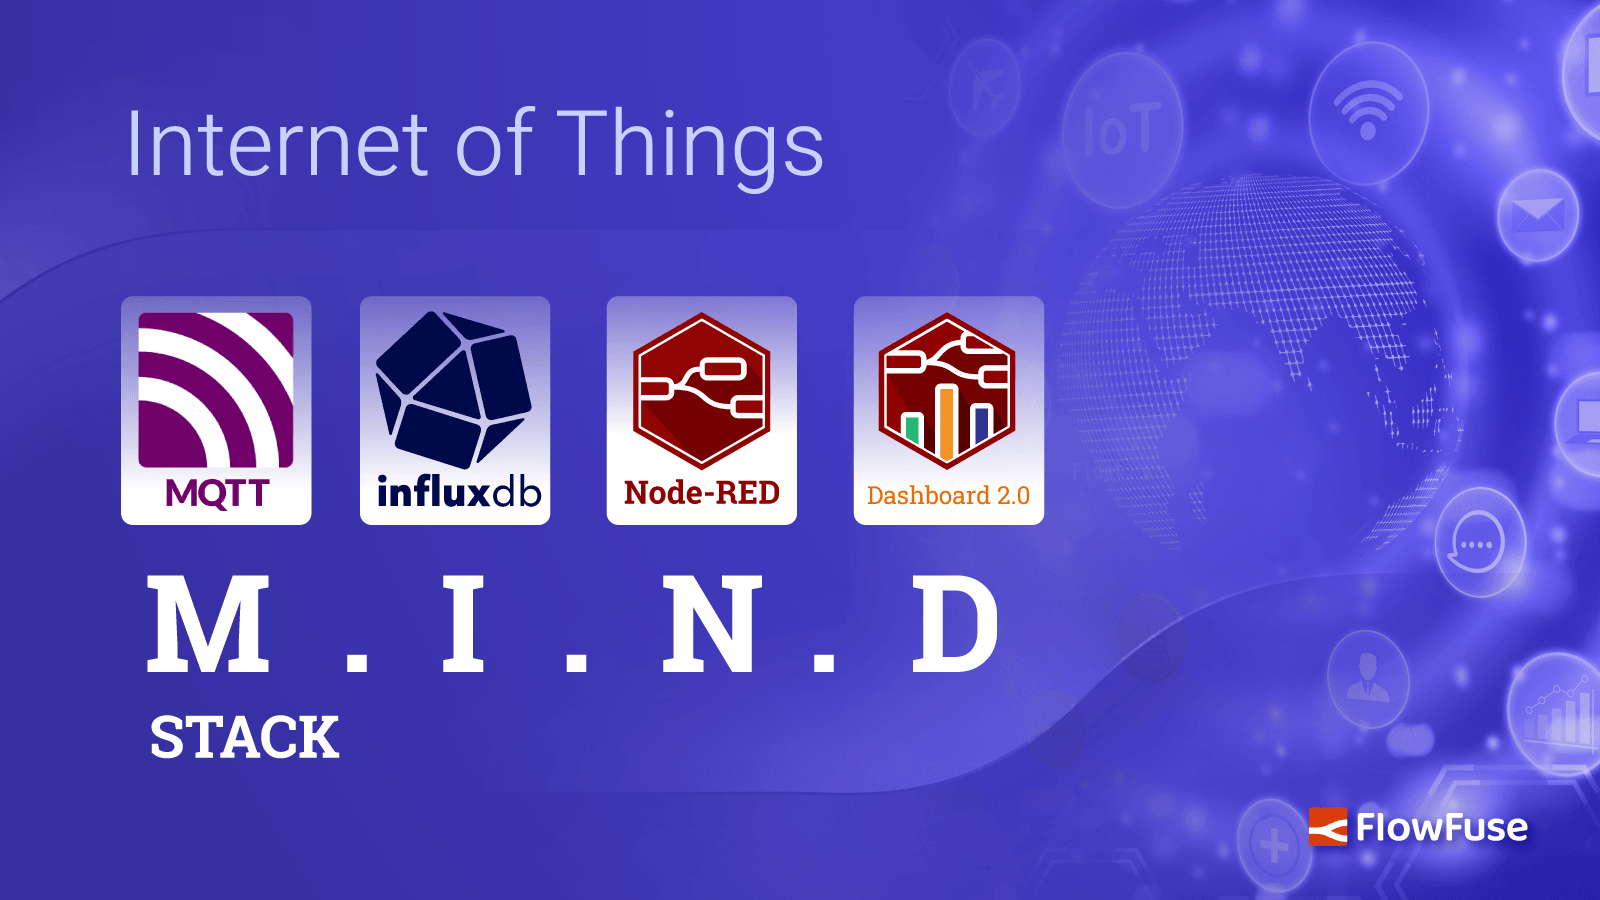
The MIND stack with Node-RED and FlowFuse Dashboard 2.0
The MING stack has gained significant popularity over the years as it built upon open-source projects. That has given way to many people leveraging this stack to build solutions upon in various different environments. The MING stack is composed of 4 main components, MQTT, InfluxDB, Node-RED, and Grafana. Combined together are the 4 main pillars, data transportation, data storage, data transformation, and visualizations. With this, it requires the management of 4 different applications, which often reside on the same server, but not necessarily. With more moving parts, creates complexity.
-
Mapping location data within Node-RED Dashboard 2.0.
Fleet management in IoT uses sensors and software to collect real-time data on vehicles, such as location, fuel consumption, and driver behavior. This data allows companies to optimize routes, reduce costs, improve safety, and enhance overall operational efficiency of their fleet. Building an application that allows the tracking of location to support Fleet management is what this post is about.
-
Comprehensive guide: Node-RED Dashboard 2.0 layout, sidebar, and styling
In this comprehensive guide, we will explore different layouts and sidebar styles in Dashboard 2.0. Additionally, we will cover how you can style Dashboard 2.0 elements effortlessly.