Blog
-
Building a Custom Video Player in Dashboard 2.0
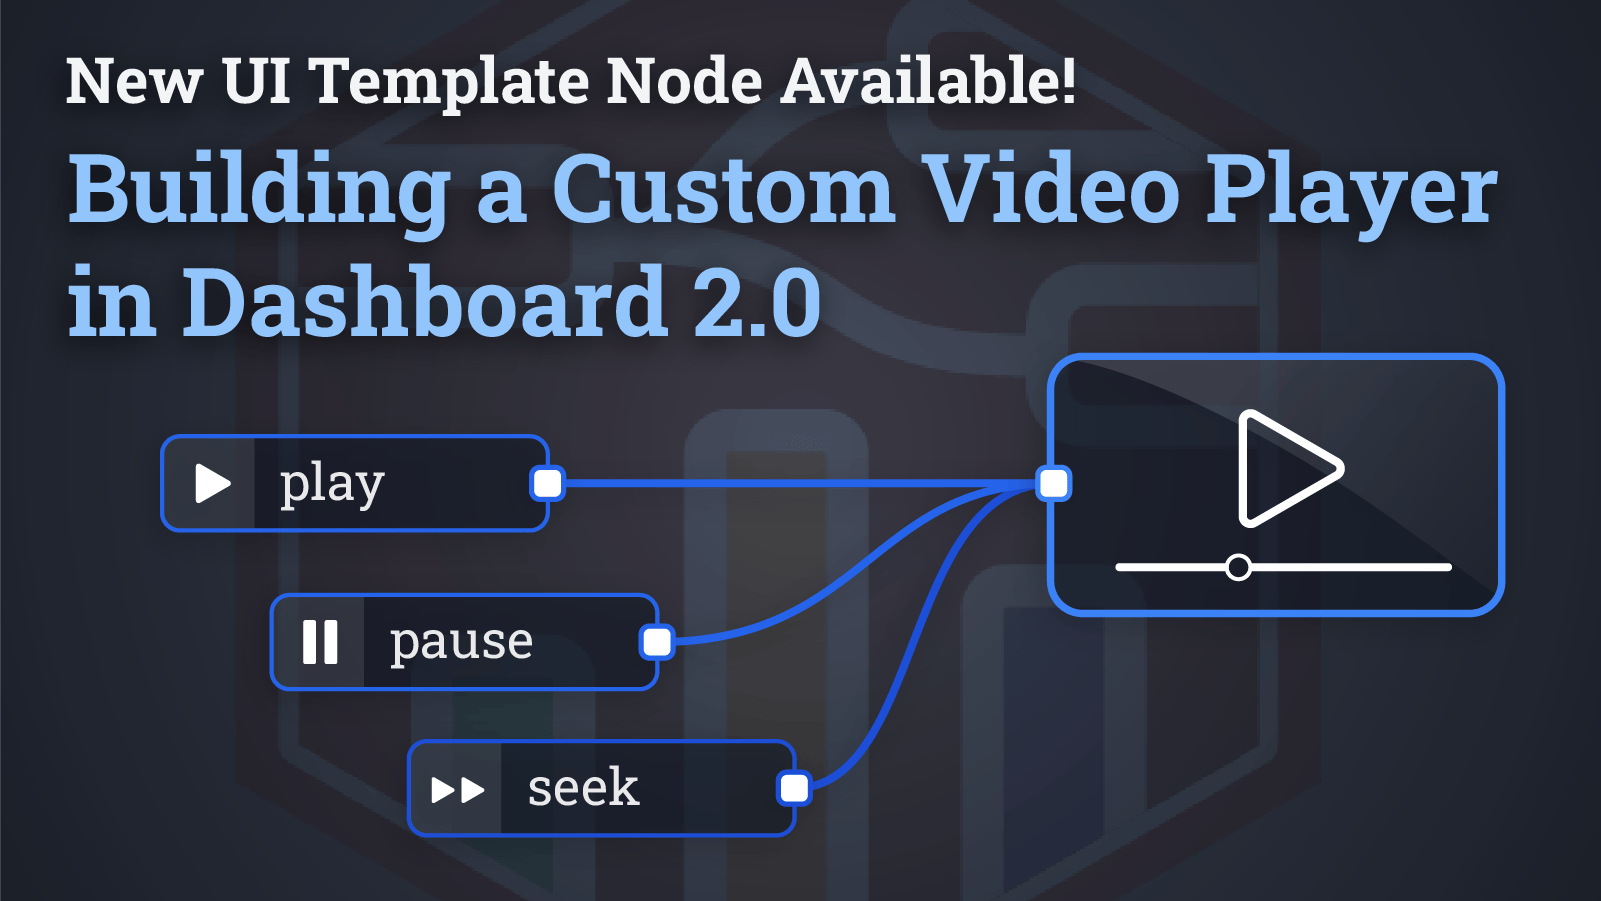
Dashboard 2.0 just got a lot more powerful with our new updates to the
ui-templatenode. New features added to the node include:- Support for a full Vue component to be defined using the VueJS Options API.
- Running of raw JavaScript within
<script />tags - Loading of external dependencies through
<script />tags
read more... -
Overhauling the Dashboard 2.0 Build Pipeline
As a developer, sometimes you have to hold up your hands and realise something you've spent two weeks building needs to be thrown away and restarted.
-
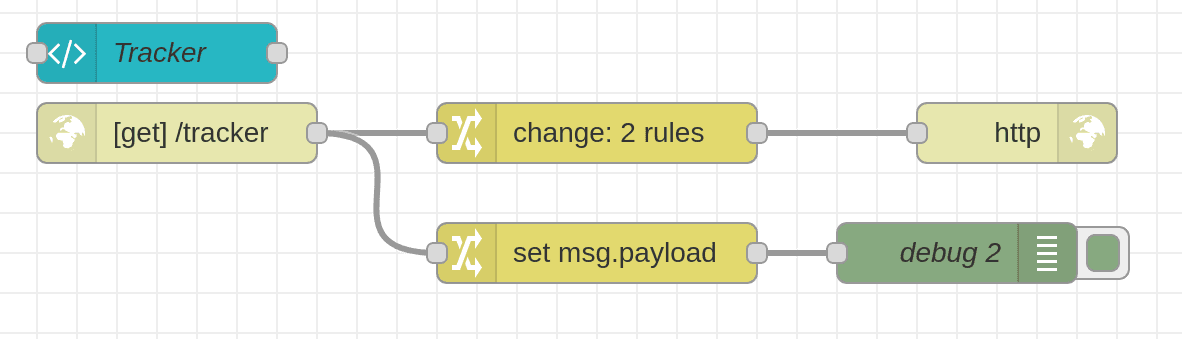
Tracking Who Has Opened a Dashboard
As we continue to add features to the Node-RED Dashboard v2 one feature request that came in was to track which users had visited a Dashboard. Multi user support for the Dashboard is on the backlog but this could be solved with the parts that are currently available.
-
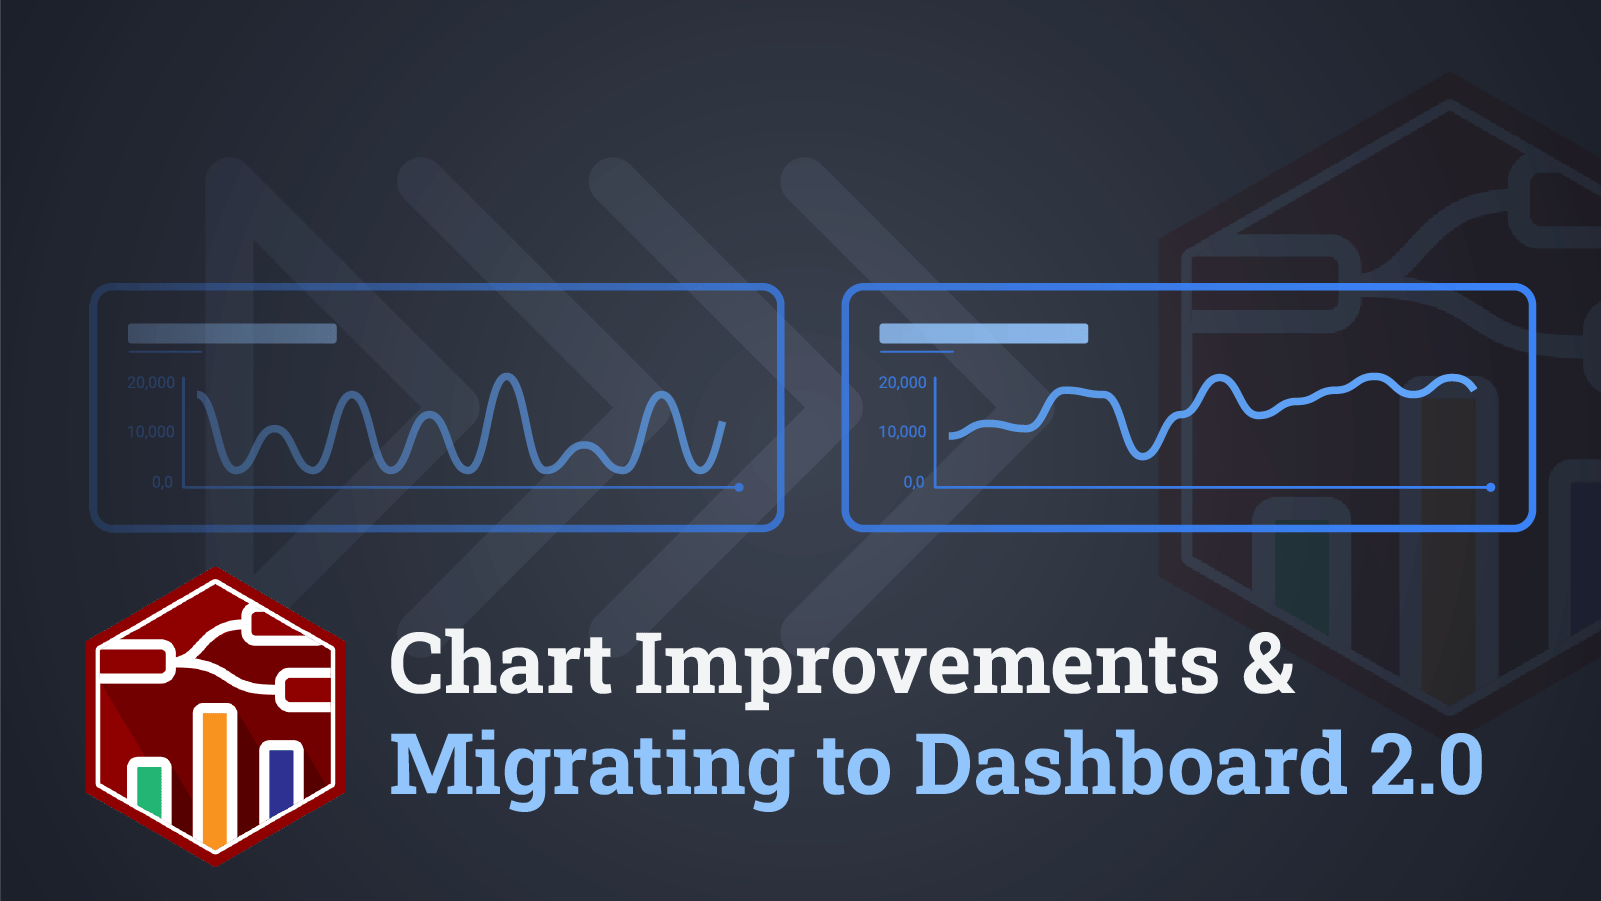
Chart Improvements & Migrating to Dashboard 2.0
It's been a little while since we've done an update, since we last posted we've moved into the 0.7.x releases for Dashboard 2.0. With these we're making big strides in improving the UX for charting your data, as well as starting to focus on migration paths from Dashboard 1.0 to 2.0.
-
Integrate your own widgets with Dashboard 2.0
With a new release, comes new features for Dashboard 2.0, and the focus of this release has been on improving the developer experience for those building third-party widgets for Dashboard 2.0.
-
Custom Vuetify components for Dashboard 2.0
Vuetify is a library of UI components using Vue. This saves the developers of Dashboard 2.0 a lot of time, but it can also help you, the end-user. As Vuetify is now included, it can be used to include any of their components. So in this post we're going to use a few of these to teach you how to use any of them.
-
Dynamic Markdown, Tables & Notebooks with Dashboard 2.0
Whilst we're still busy backporting through the existing Dashboard 1.0 features, we did want to highlight some new features we've built in Dashboard 2.0 released this week.
-
Dashboard 2.0 - Community Update
Welcome to the latest Node-RED Dashboard 2.0 update. We've added lots of new widgets, cleaned up compatibility issues alongside Dashboard 1.0 and made strides to improve the events system linking the Node-RED editor with the Dashboard.
-
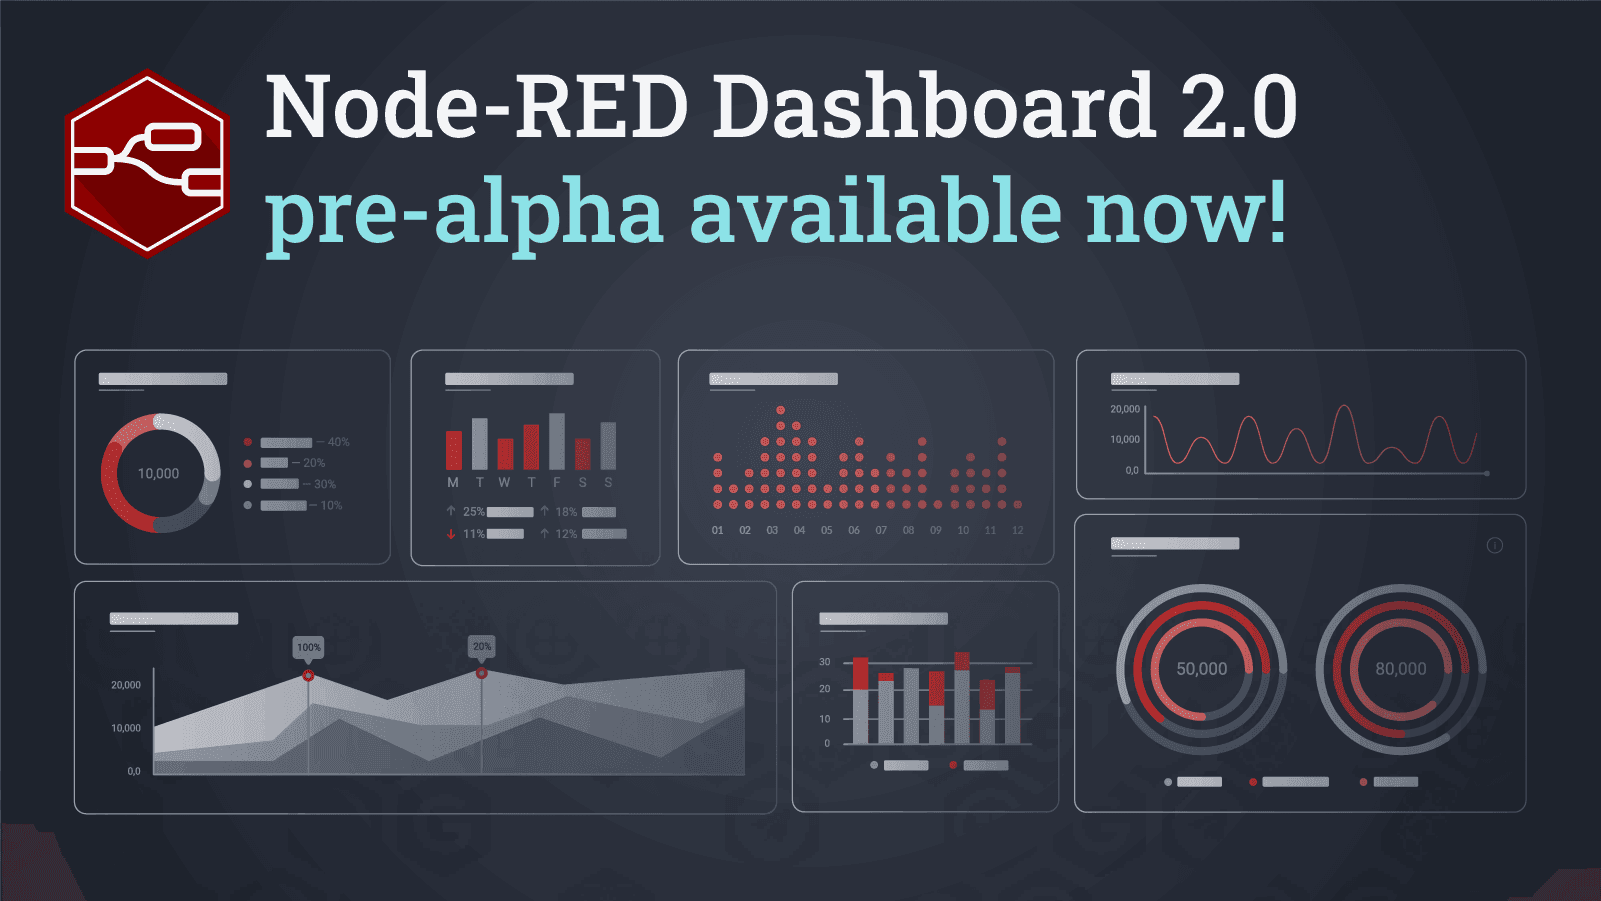
First Pre-Alpha Release of the new Node-RED Dashboard
Just weeks ago, we at FlowFuse announced our plan to develop a successor to the Node-RED Dashboard. Today, we're excited to reveal the pre-alpha release of this highly anticipated project, bringing us one step closer to a new era of data visualization in Node-RED.
-
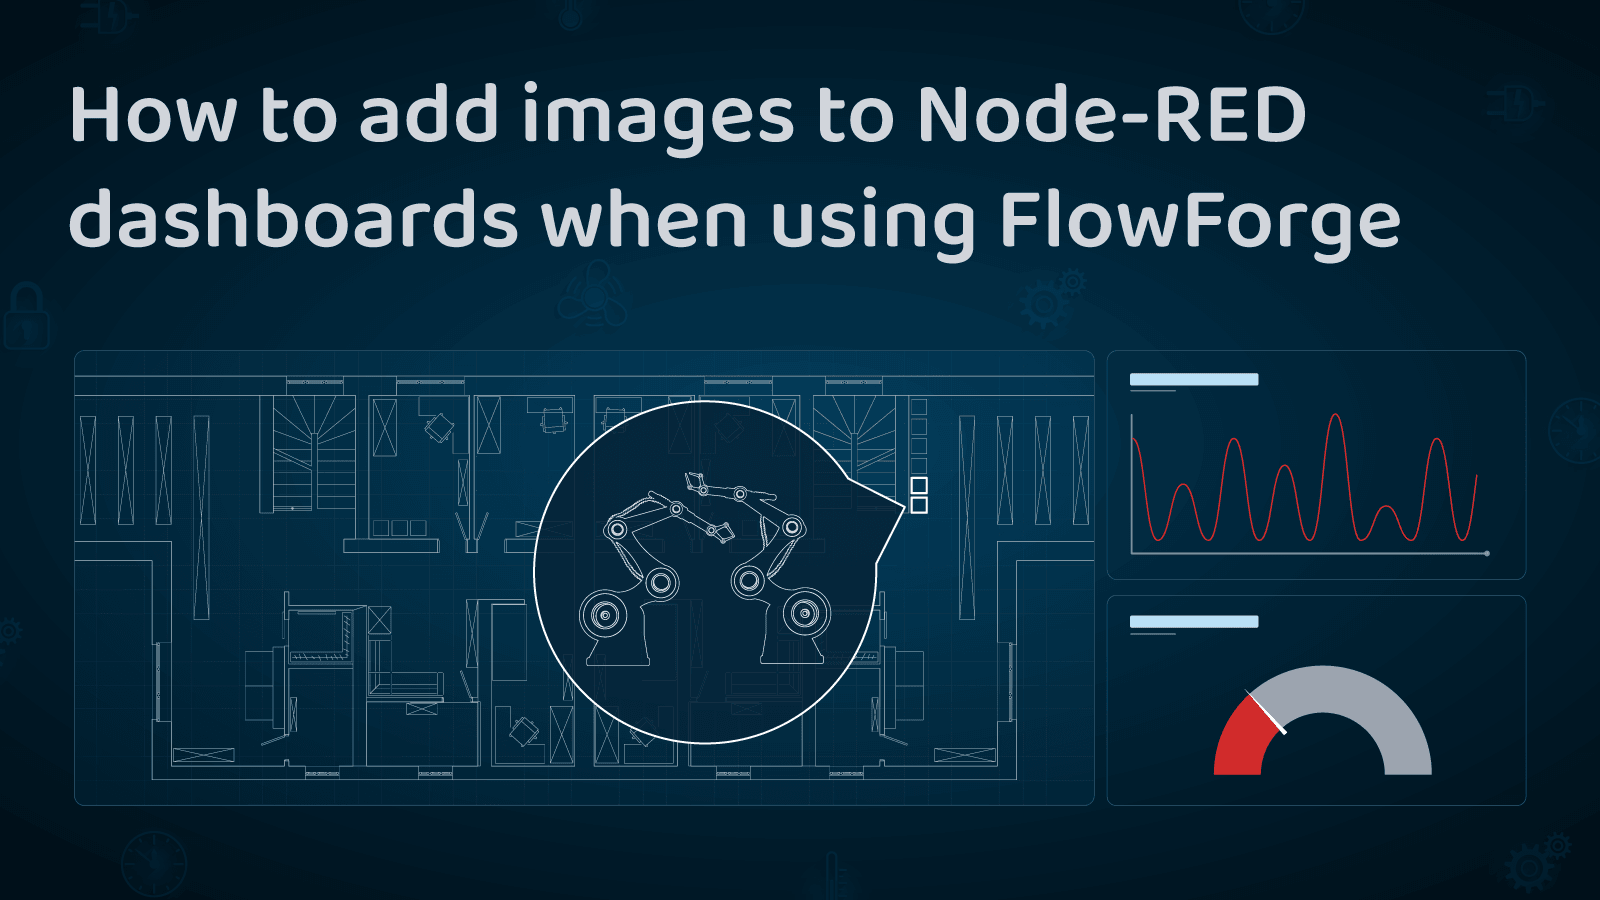
How to add images to Node-RED dashboards when using FlowFuse
Using images in your Node-RED dashboards can significantly improve your users' experience. The most common method to add images to dashboards is to store them within the filesystem of an Node-RED instance but sometimes that's not an option. How can you easily use images when working in a containerized environment such as Docker, or Kubernetes? We will also explore latest feature from FlowFuse that makes this step super easy.
-
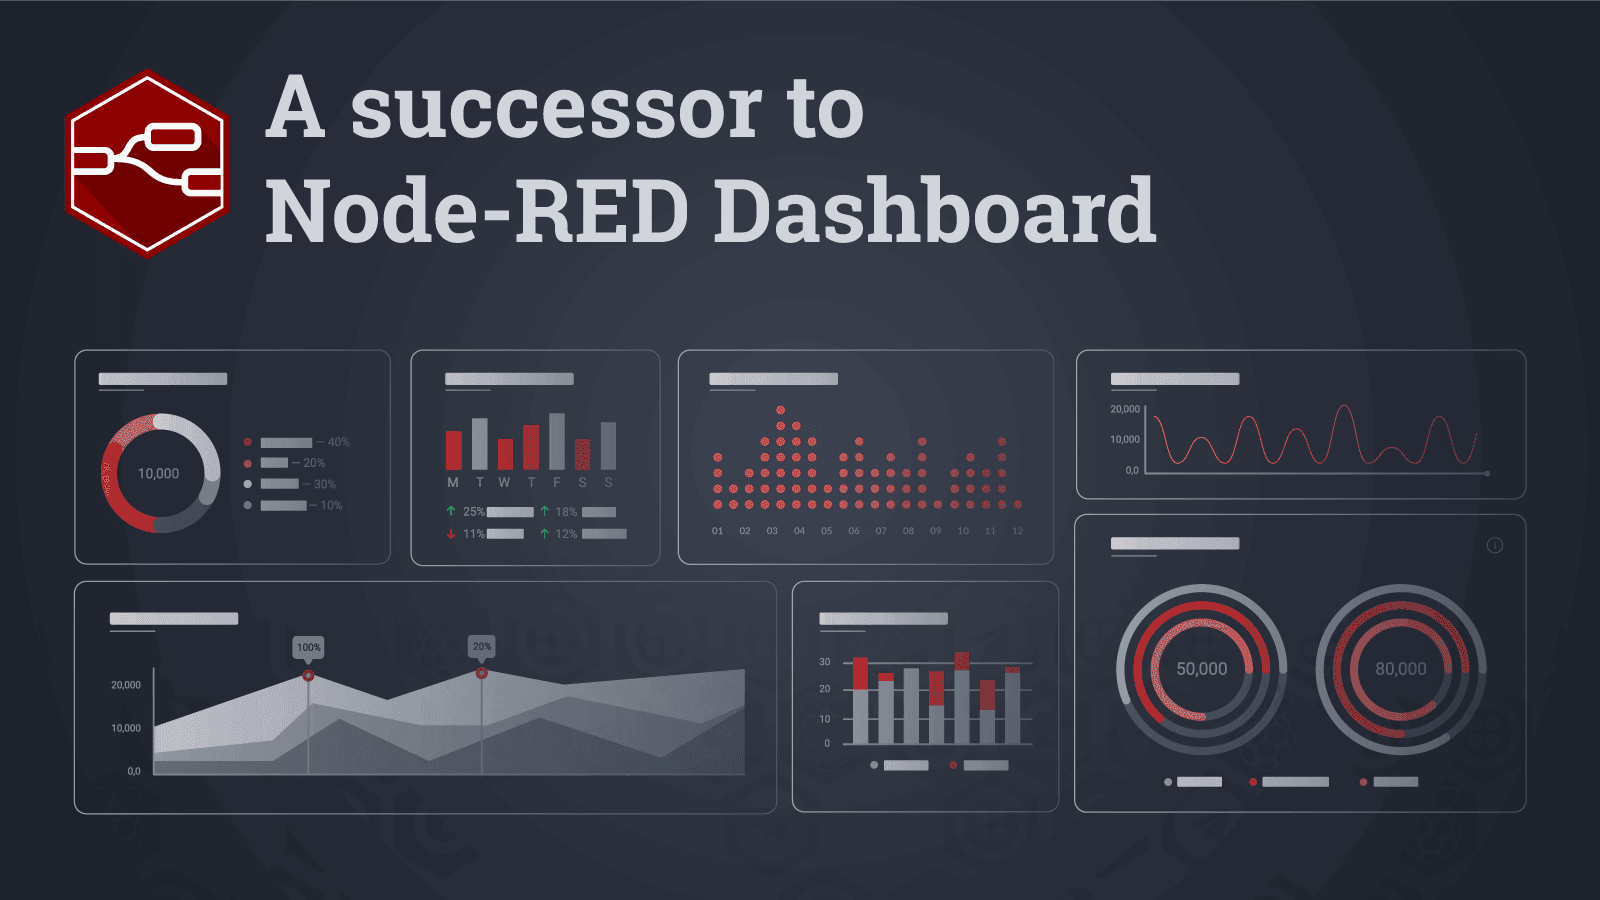
The Next Step in Data Visualization - Announcing the Successor to the Node-RED Dashboard
For the past several years, the Node-RED Dashboard has been an indispensable tool for many Node-RED users. It has offered a seamless way to create live dashboards, enabling the quick and intuitive creation of user interfaces for Node-RED flows. However, as the saying goes, "all good things must come to an end."
-

Node-RED Tips - Dashboard Edition
There is usually more than one way to complete a given task in software, and Node-RED is no exception. In each of this series of blog posts, we are going to share three useful tips to save yourself time when working on your flows.
-
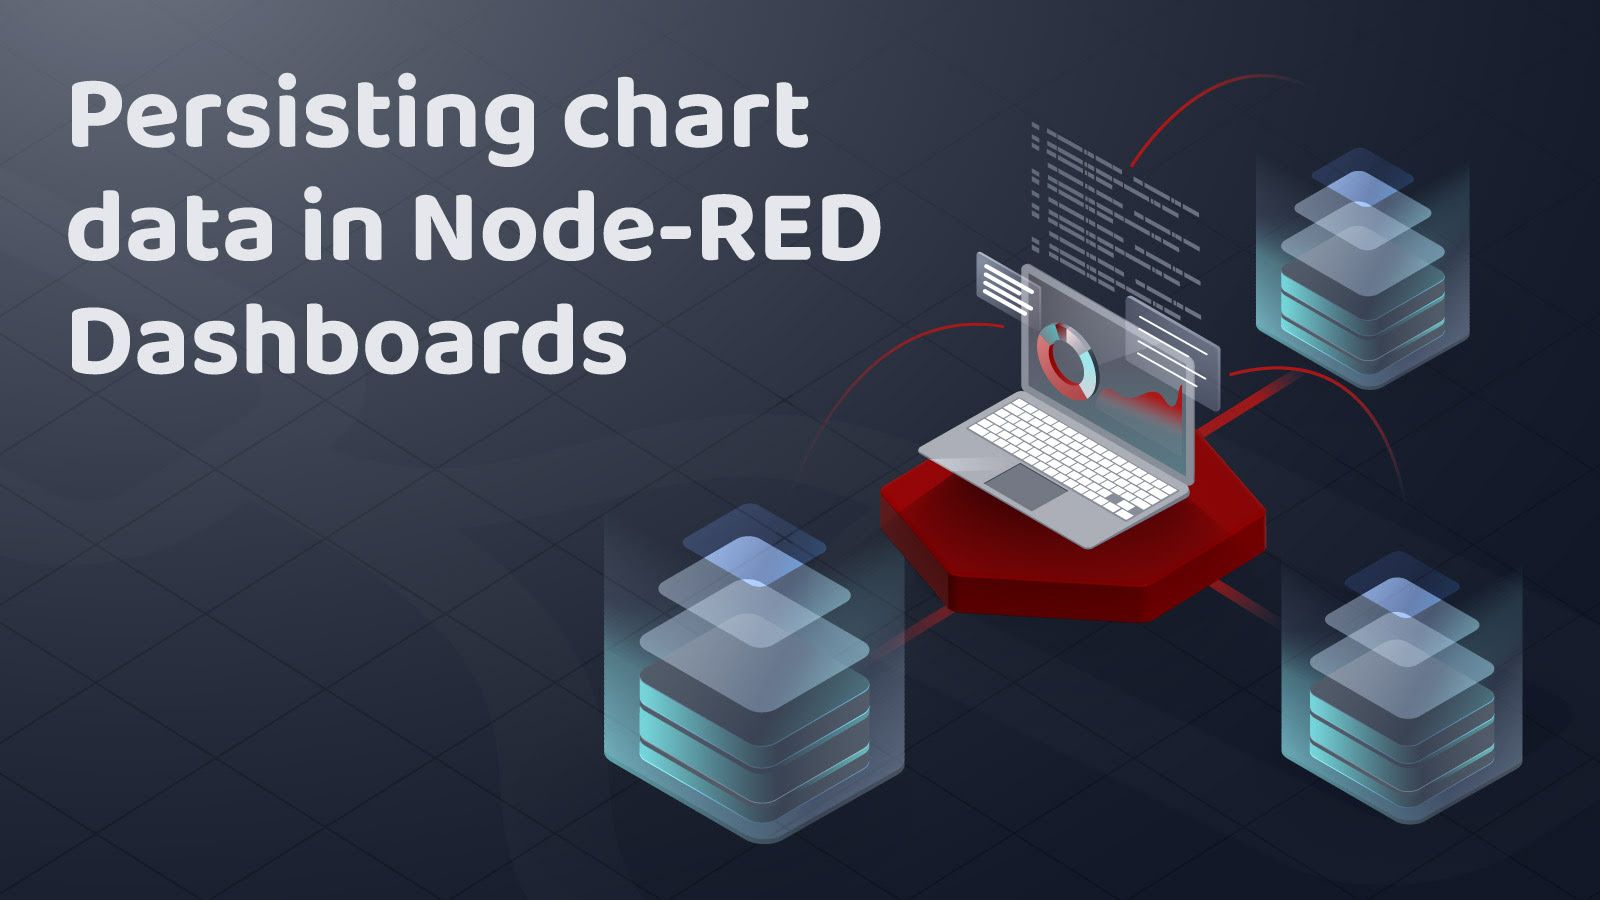
Persisting chart data in Node-RED Dashboard 1
Node-RED makes it easy to create HMI (Human Machine Interfaces) using Node-RED Dashboard.
-
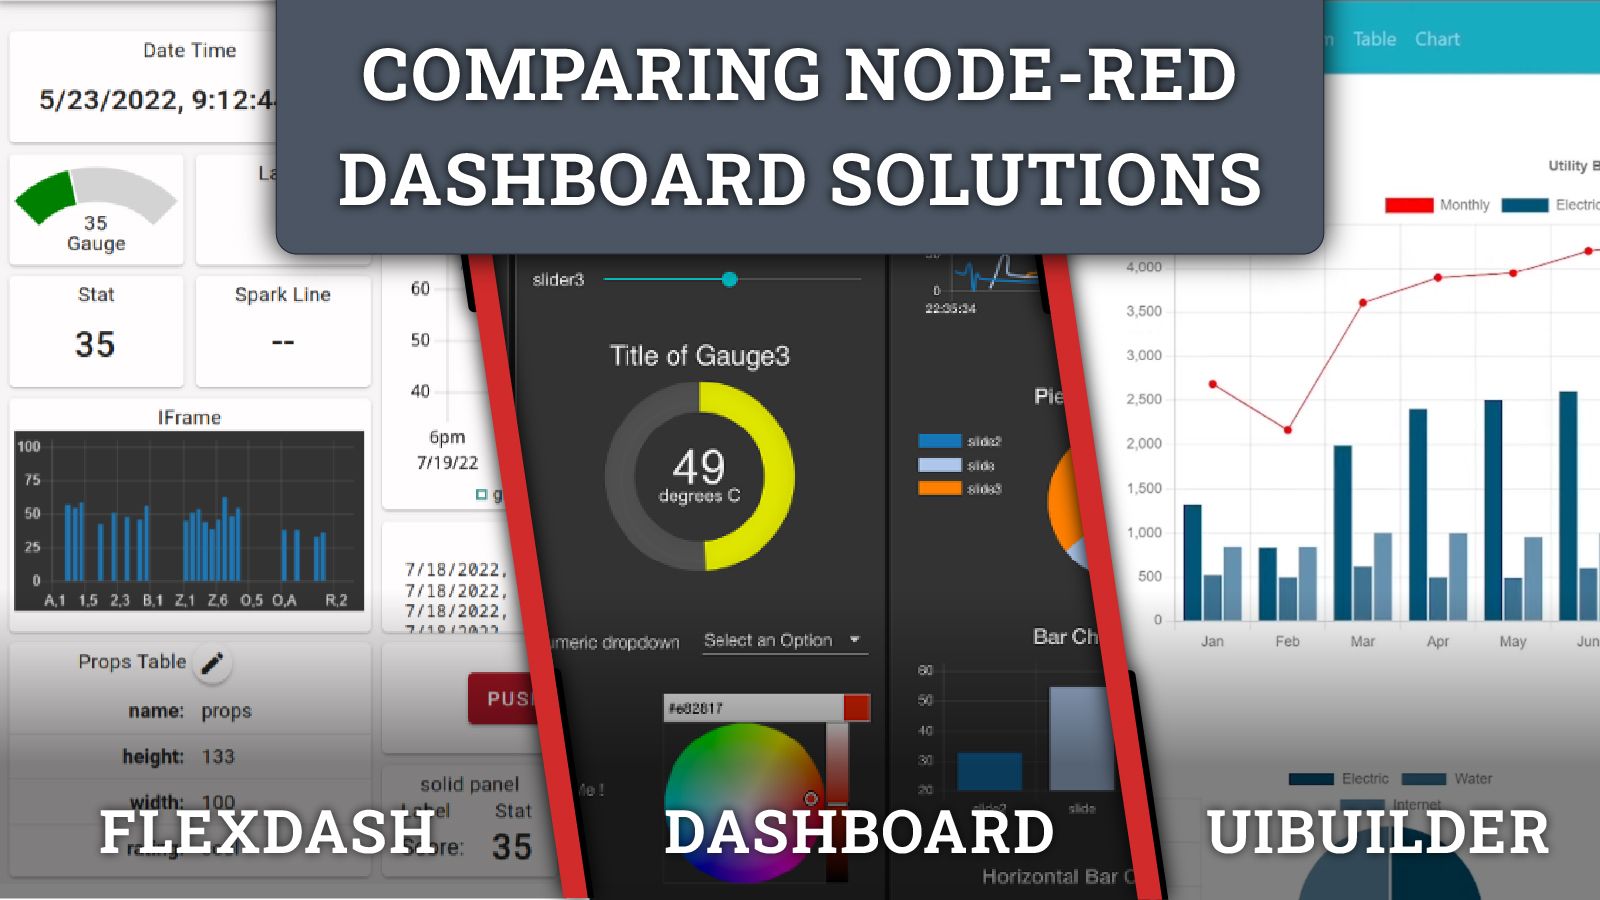
Comparing Node-RED Dashboards Solutions
Dashboards are a great feature of Node-RED, allowing you to easily expose data visualisations and interactive elements of your flows to users via a web browser. I often see discussions in the community about which dashboard option is best for any given scenario, I wanted to compare the most popular options as they stand in early 2023.